Databases and reports Calculators

Alpha version · password access

Energy price calculators

You enter the project assumptions, for example the power of an energy storage system, and the result is calculated on real prices from the Polish market, quarter-hour by quarter-hour. We have ten such calculators, with password access. We also build them to order around your data and questions. The calculators have a Polish interface, but the numbers and charts are clear without knowing the language, and we answer questions in English.

What's inside

Ten questions the calculators answer

At noon the wholesale energy price is sometimes negative; in the evening it reaches several hundred zloty per MWh. That gap decides whether a storage system pays off, whether a farm sells its energy well and whether a fixed price in the contract was a good move. The calculators work this out on Polish market data and show every step of the calculation.

Who it is for: investors in energy storage and renewables, owners of solar and wind farms, companies that buy a lot of energy, energy market advisers and analysts.

Click a question to see the calculator.

The numerical examples come from the calculators, for the stated scenario and period. The data ends on 19 September 2026.

01 · Pivot table

Price and generation map

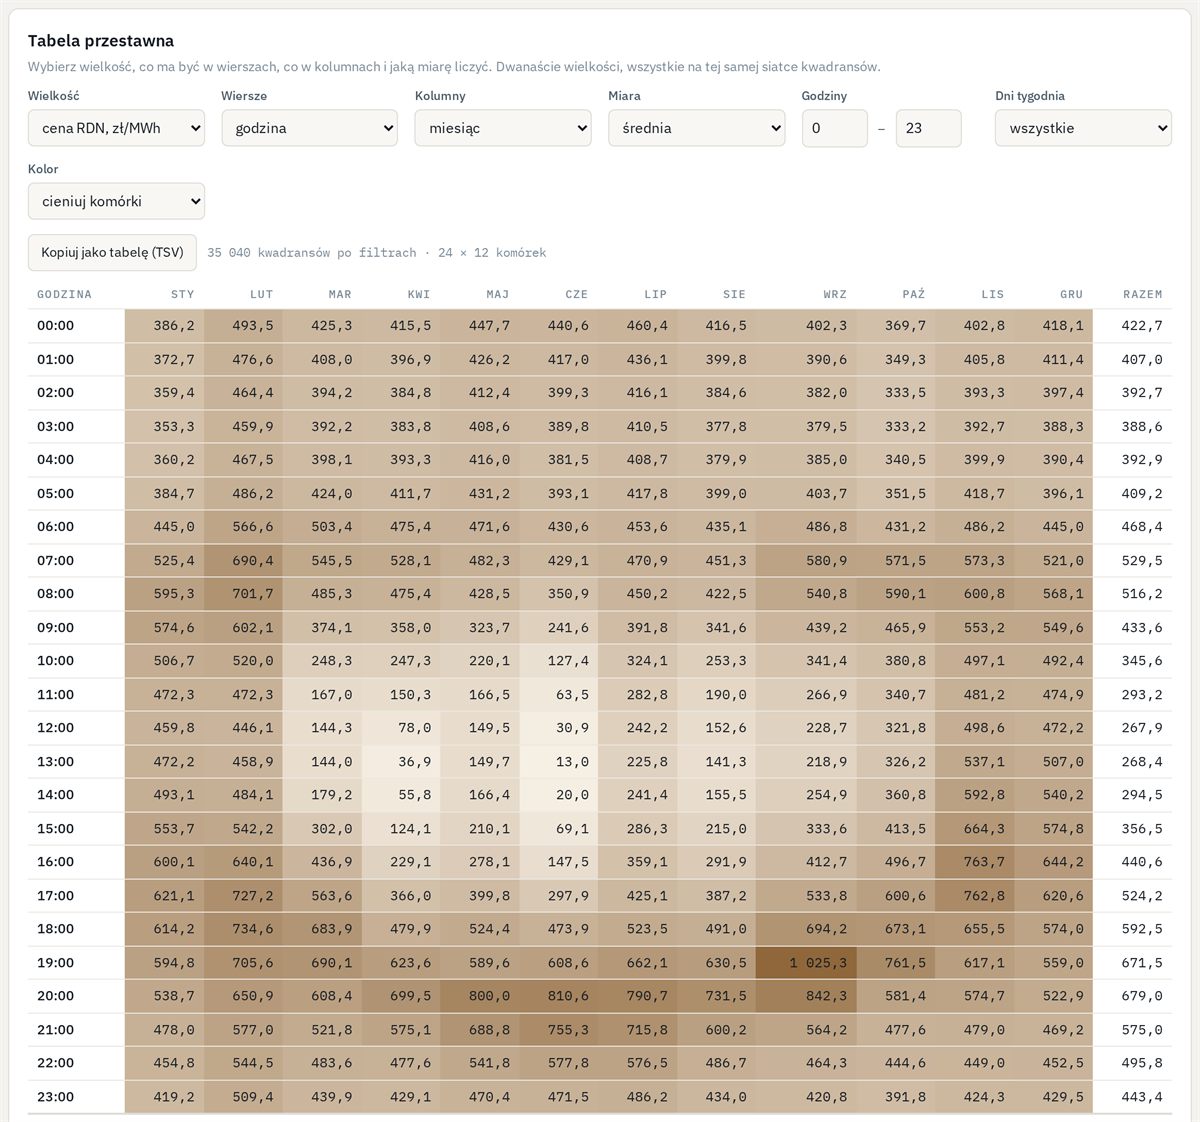
At what hour, in which month and on which days energy is cheapest and when it is most expensive. One table, any cross-section.

Who it is for
Analysts, energy traders, companies planning their consumption, anyone who wants to see the market first and run the numbers after.

Example, June 2025

Energy at 13:00 cost an average of PLN 9/MWh, and at 20:00 as much as PLN 868/MWh. The midday trough and the evening peak are visible on a single map.
Request access

Screenshot of the price map calculator: settings and a table of average energy prices in 2025, with hours in rows and months in columns.
2025 · average price · hour × month
02 · Storage calculator

Will the storage system pay off?

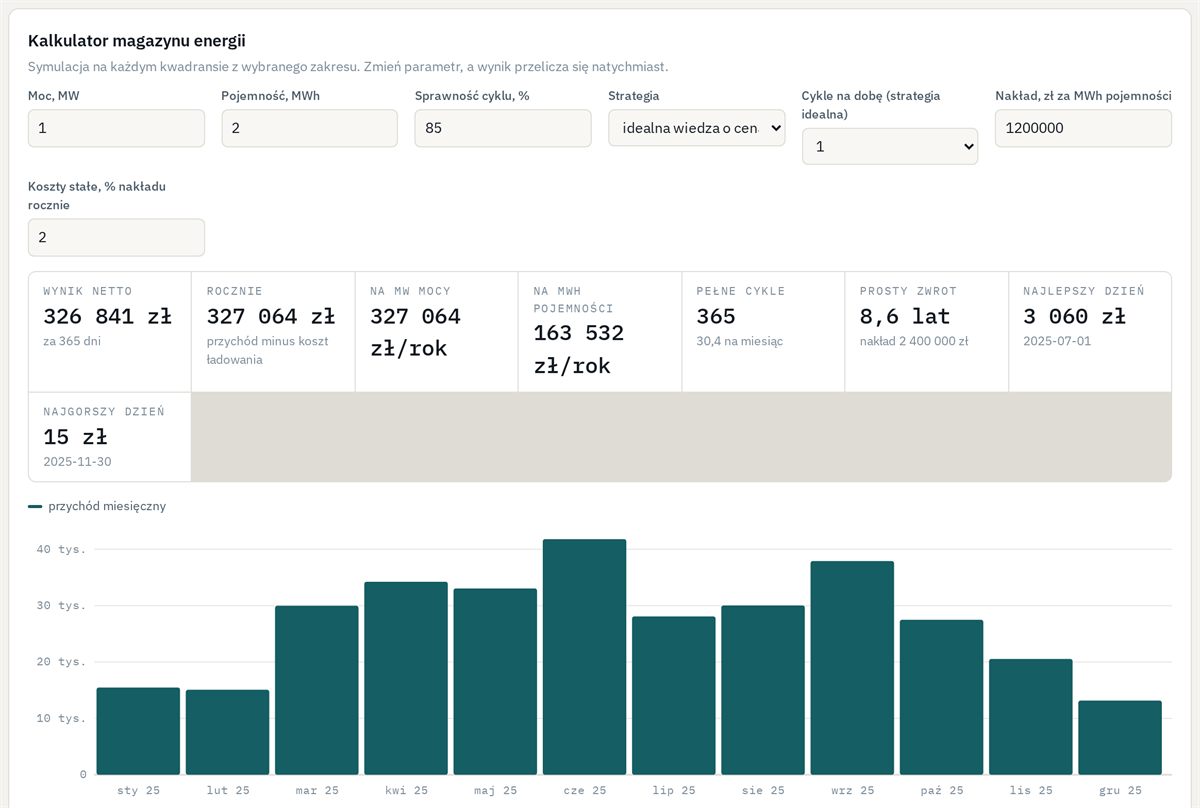
Enter the power, capacity and investment cost. The calculator runs the storage system through every quarter-hour of the chosen period and shows revenue, cycles and payback period.

Who it is for
Investors and developers of energy storage, farm owners considering adding a battery, banks and funds assessing projects.

Example, 2025

A 1 MW / 2 MWh storage system, one cycle a day, capex of PLN 1.2 million per MWh: PLN 323,000 in annual result and simple payback after 8.7 years. This is the upper limit for one cycle a day, calculated with the day's prices known in advance, within the power and capacity limits of the storage system.

Request access

Screenshot of the energy storage calculator: annual result, payback period, number of cycles and a month-by-month chart of the result.
2025 · storage 1 MW / 2 MWh · one cycle a day
03 · Day step by step

A day in the life of a storage system

Pick a date and see what the storage system did in every quarter-hour: when it charged, when it discharged, at what price and how much it earned.

Who it is for
Investors who want to understand how the money is made, not just the final result. Boards and investment committees. People who explain storage to others.

Example, 1 May 2026

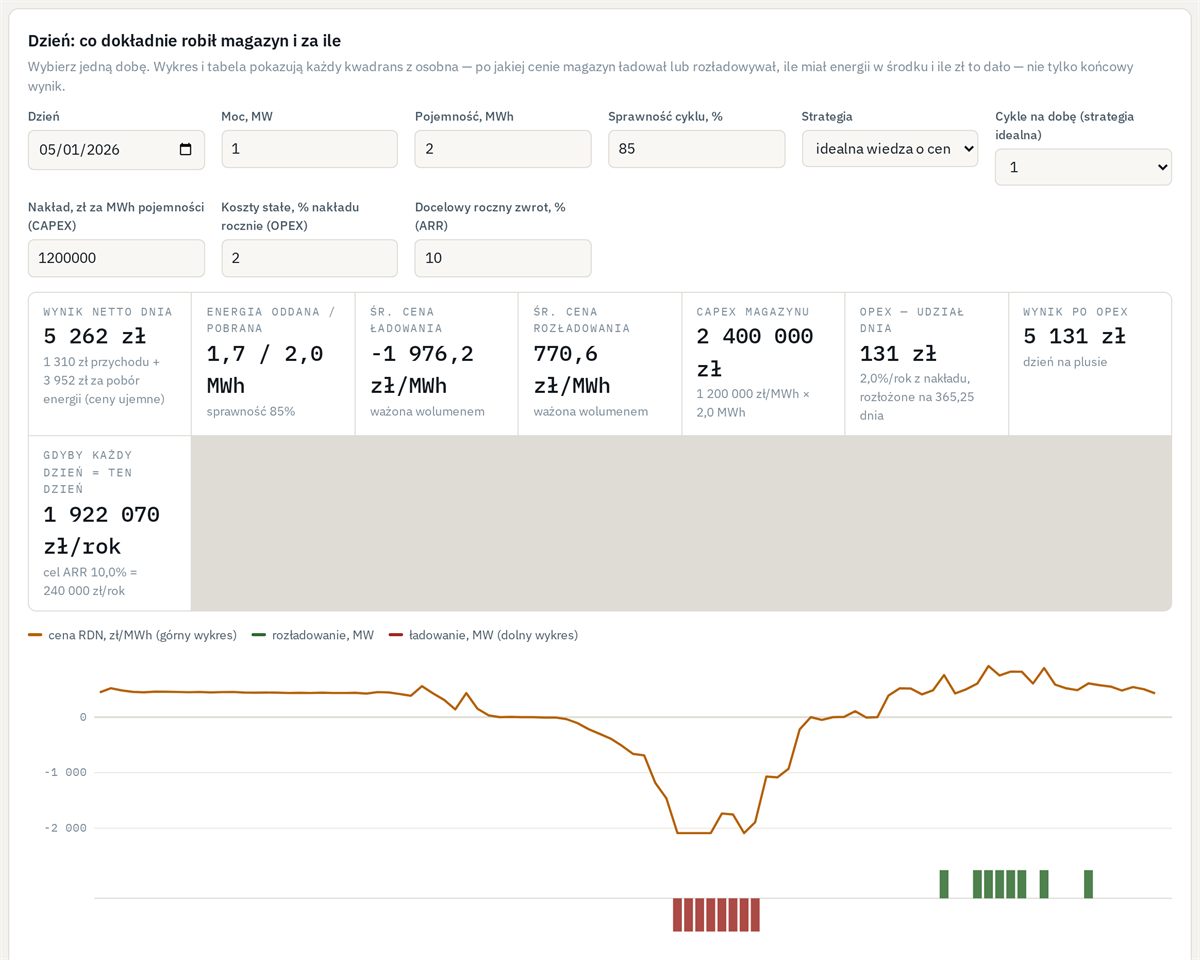
At noon the price fell to around PLN −2,000/MWh. A 1 MW / 2 MWh storage system was paid almost PLN 4,000 just for taking energy, and in the evening sold it at an average of PLN 771/MWh. Result for the day: PLN 5,262.

Request access

Screenshot of the single-day storage calculator: the price dropping below zero at noon, charging at midday and discharging in the evening.
1 May 2026 · storage 1 MW / 2 MWh
04 · Contract versus spot

Fixed price or the market?

The same volume of energy calculated twice: at the contract price and at market prices. You see straight away who came out ahead.

Who it is for
Companies buying energy (plants, retail chains, data centres), energy suppliers, parties to PPAs.

Example, 2025

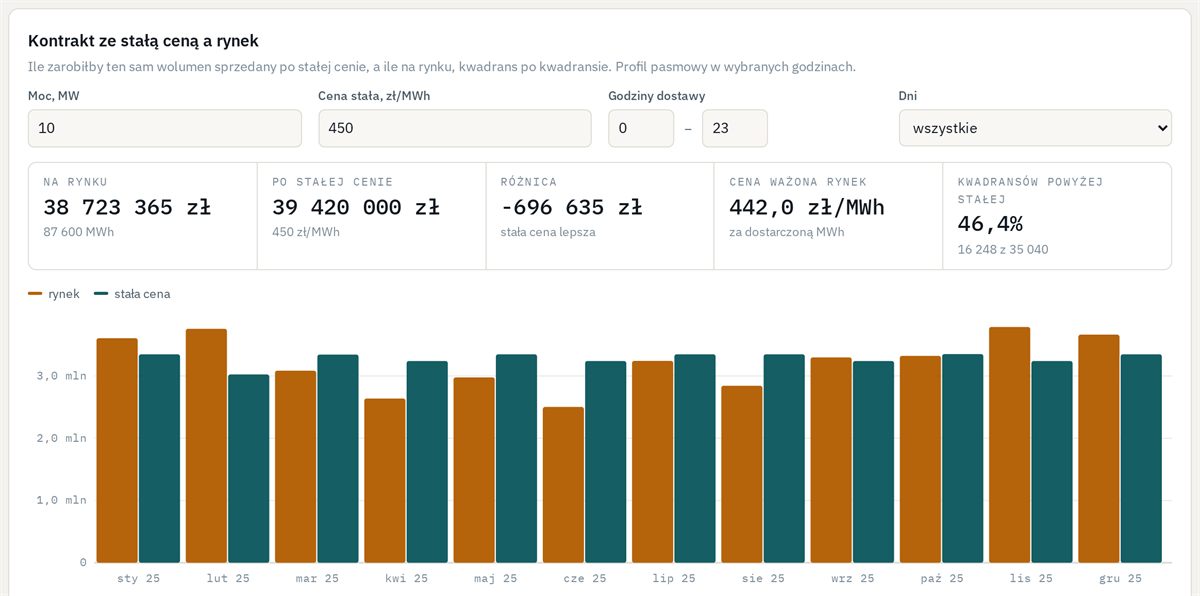
A 10 MW baseload for the whole year. The market gave PLN 442/MWh, so a contract at PLN 450/MWh would have been better for the seller by PLN 696,000. Over the whole period since June 2024 it was the other way round: the market won by PLN 2.7 million. Same contract, different period, different winner.

Request access

Screenshot of the fixed-price contract calculator: value of deliveries at market prices and at the contract price in 2025.
2025 · 10 MW baseload · fixed price PLN 450/MWh
05 · Price thresholds

How many hours was the wholesale price negative?

Set a threshold and check how many hours the price was below or above it, in which months and how long the longest runs lasted.

Who it is for
Solar farm owners, companies with flexible consumption, storage investors, analysts.

Example, 2025

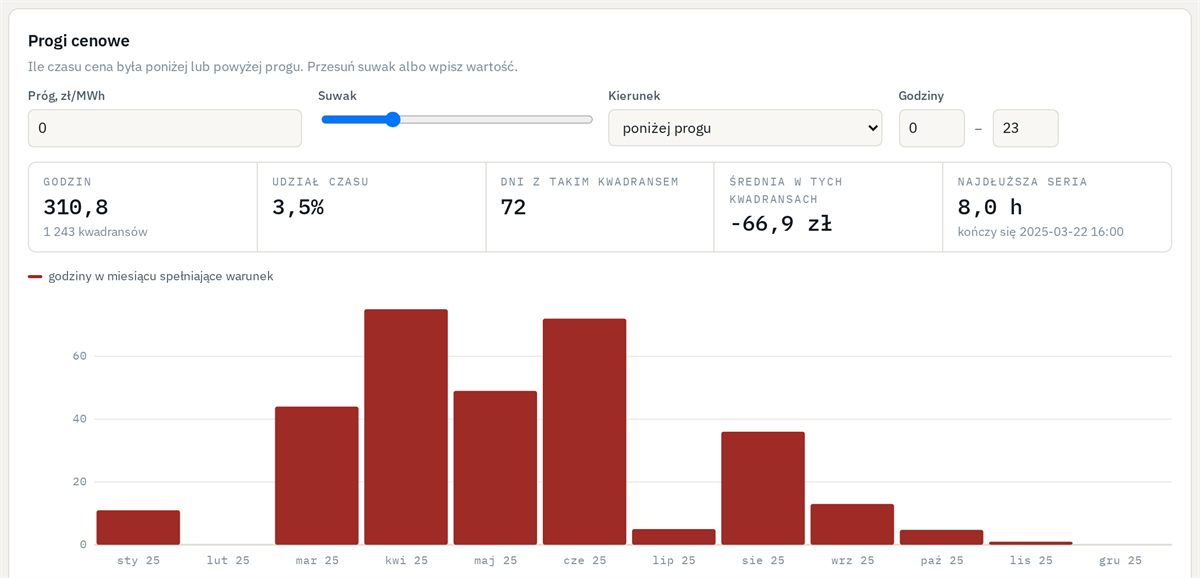
The price was negative for 311 hours, on 72 days. The longest run lasted 8 hours (22 March). The average price in those quarter-hours was PLN −67/MWh.

Request access

Screenshot of the price threshold calculator: number of hours with a price below zero in each month of 2025.
2025 · threshold PLN 0/MWh
06 · Farm revenue

What price do you really sell your energy at?

A solar or wind farm does not get the average market price. It gets the price from the hours in which it generates. The calculator estimates what that is and how much the farm loses by generating at the same time as thousands of others.

Who it is for
Owners of and investors in solar and wind farms, PPA offtakers, banks financing renewables.

Example, 2025, 10 MW solar

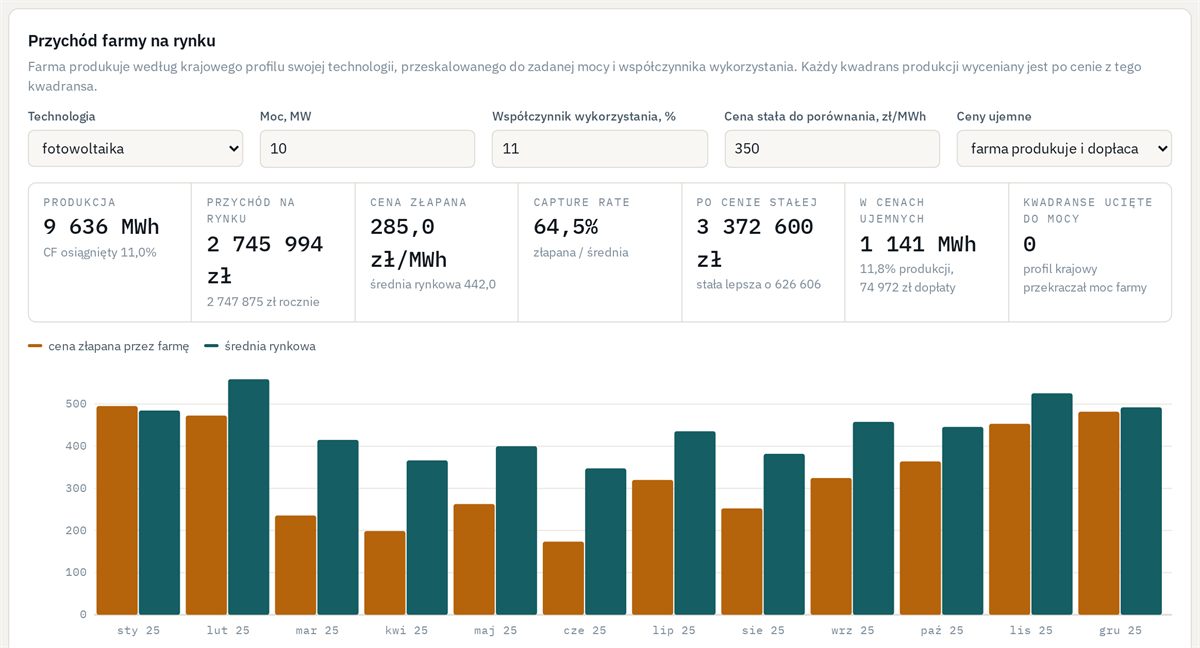
The farm captured an average of PLN 285/MWh against a market average of PLN 442/MWh, or 64.5% of the average. 11.8% of its output fell in hours with a negative price. A contract at PLN 350/MWh would have brought in PLN 627,000 more.

Request access

Screenshot of the farm revenue calculator: the price captured by a solar farm against the average market price.
2025 · solar 10 MW · fixed price PLN 350/MWh
07 · Imbalance cost

How much does a bad generation forecast cost?

A farm declares a day ahead how much it will generate. Every difference is settled at a different price. The calculator shows how much a forecast error costs and how that cost falls when the forecast is better.

Who it is for
Owners of wind and solar farms, balance responsible parties, generation forecast providers.

Request access

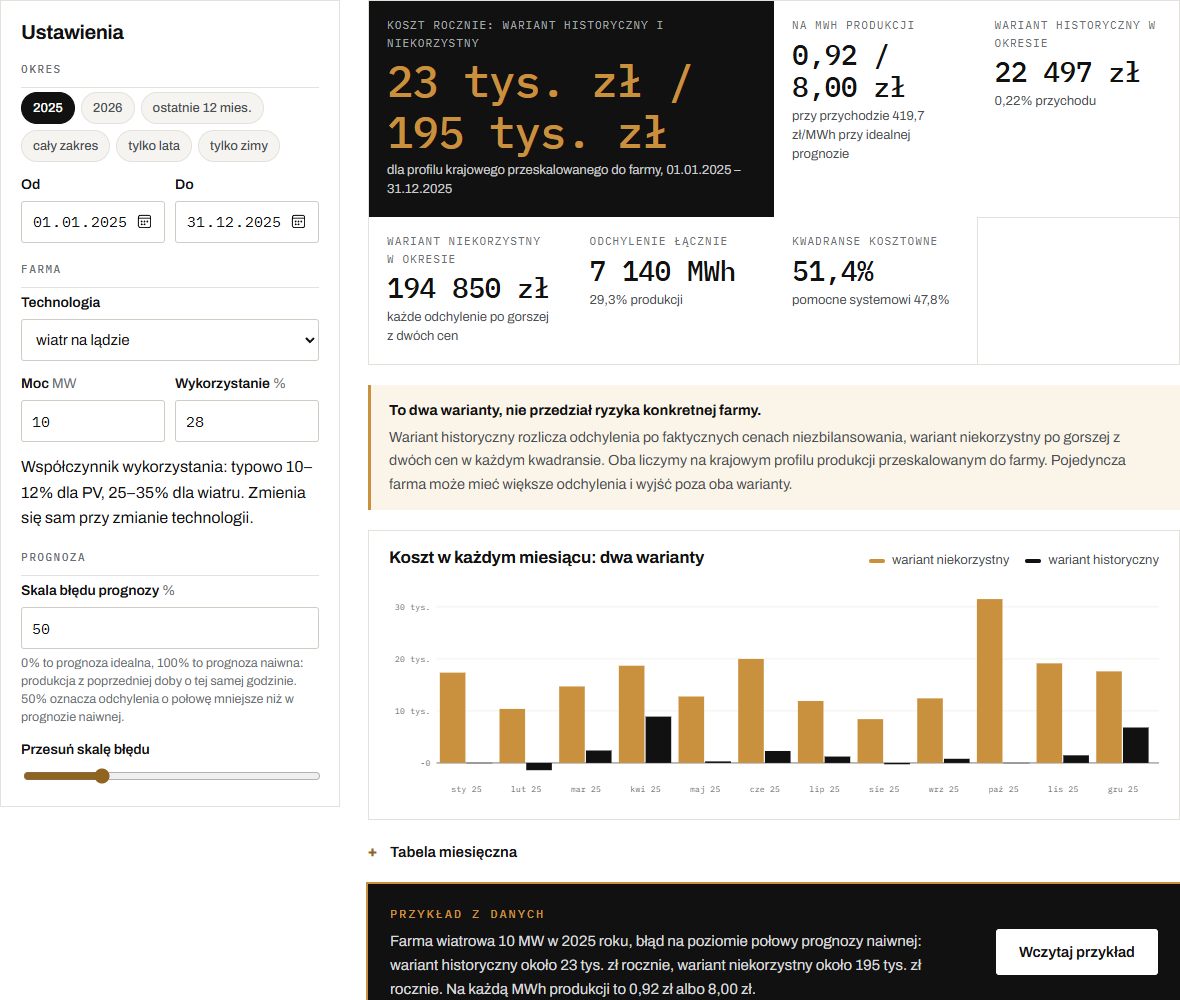
Screenshot of the imbalance cost calculator: cost under the historical and the unfavourable scenario, with a monthly chart.
2025 · wind 10 MW · forecast error 50%
08 · Renewable curtailment

How much renewable energy was curtailed?

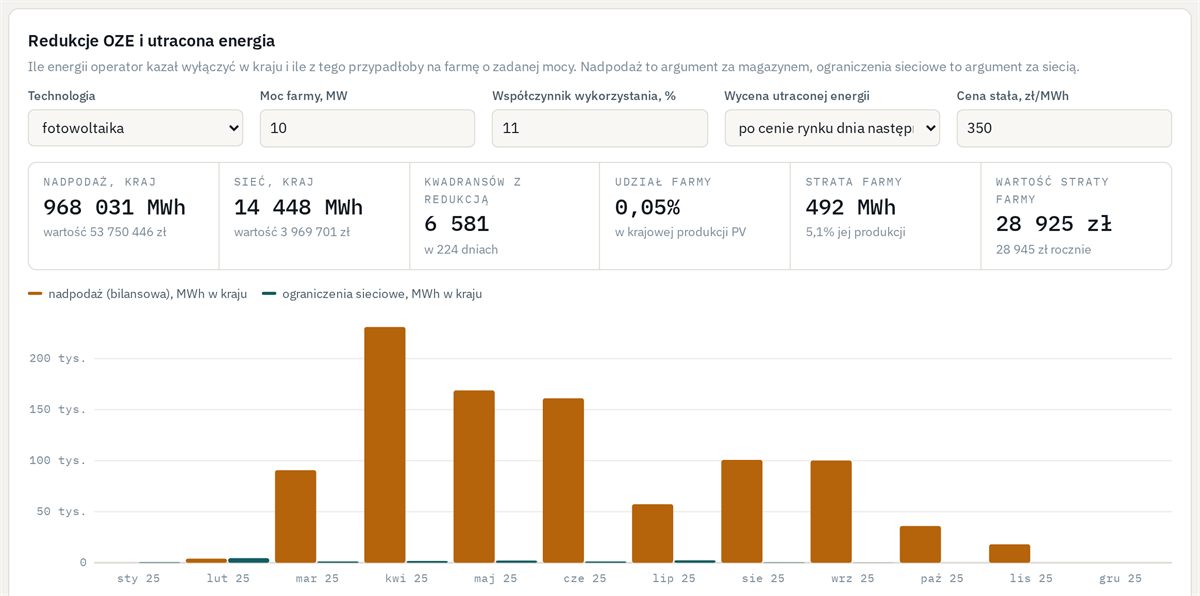
The system operator is ordering wind and solar farms to switch off more and more often. The calculator shows how much energy was lost this way nationally and how much of it could have fallen on your farm.

Who it is for
Renewable farm owners, storage investors for whom curtailment is an argument, grid and energy policy analysts.

Example, 2025

Because of oversupply, over 968 GWh of solar energy was curtailed nationally, with curtailment on 224 days. In summer 2026 solar curtailment was 74% higher than in summer 2025.

Request access

Screenshot of the renewable curtailment calculator: energy curtailed nationally in 2025, split into oversupply and grid constraints.
2025 · solar 10 MW
09 · Period comparison

What has changed over a year?

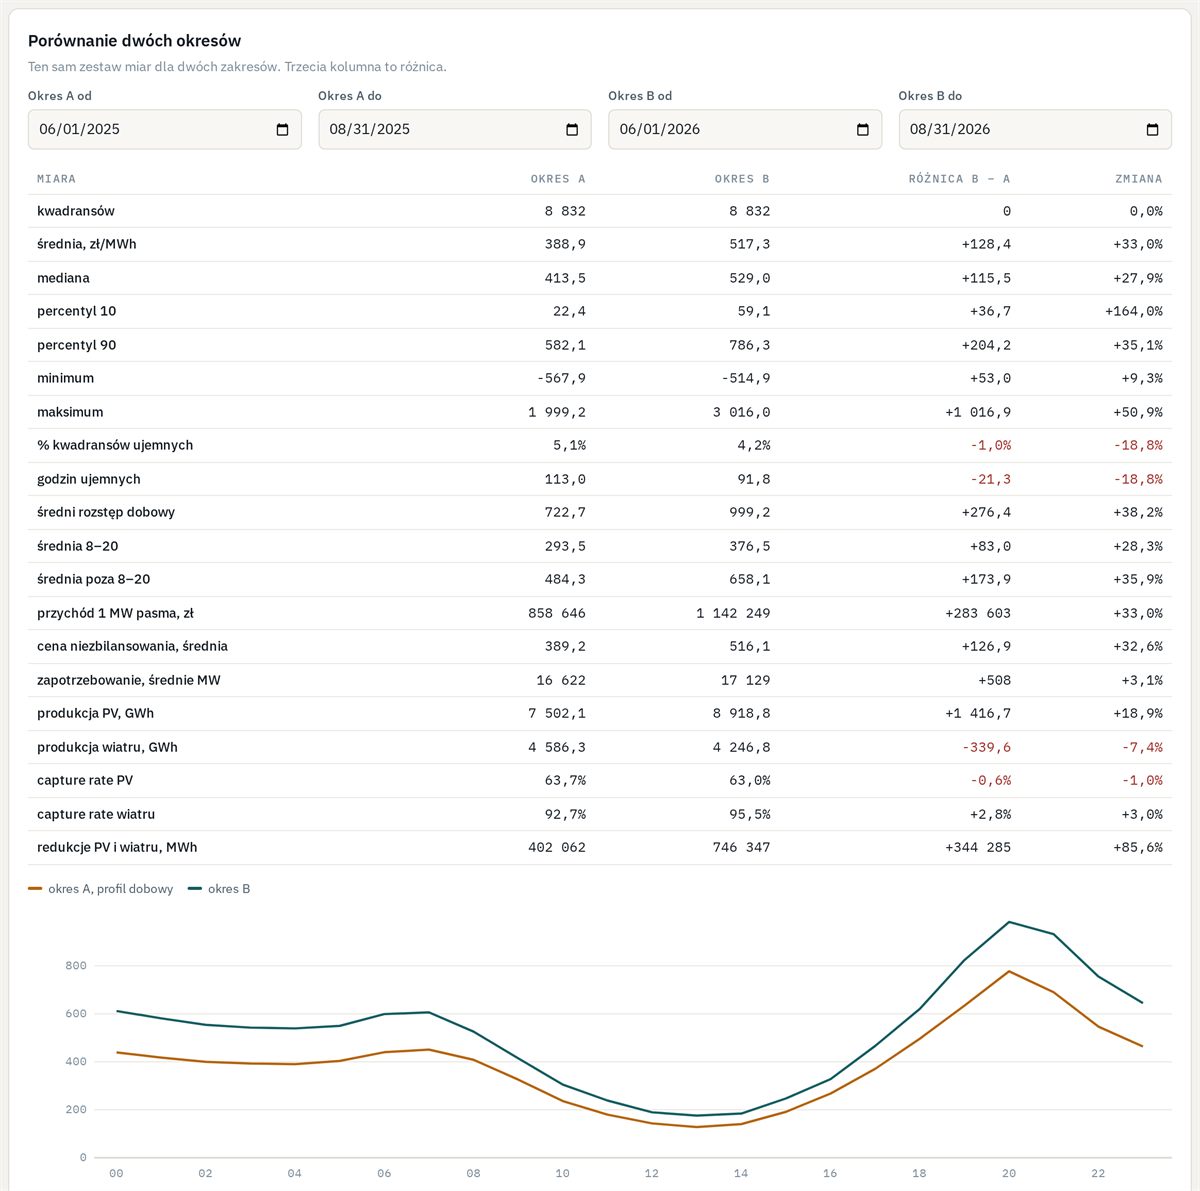
Any two periods side by side: prices, volatility, renewable generation, curtailment, revenue. The difference in zloty and in per cent.

Who it is for
Boards, analysts, advisers preparing reports, anyone who has to answer whether things are better or worse than a year ago.

Example, summer 2026 against summer 2025

Average price +33%, average spread between the cheapest and the most expensive quarter-hour of the day +38% (from PLN 723 to PLN 999/MWh), renewable curtailment +86%. Good news for storage, because the spread is exactly what it earns on.

Request access

Screenshot of the period comparison calculator: a table of measures for summer 2025 and summer 2026, with daily price profiles.
summer 2025 against summer 2026
10 · Price outlook

Where prices are heading

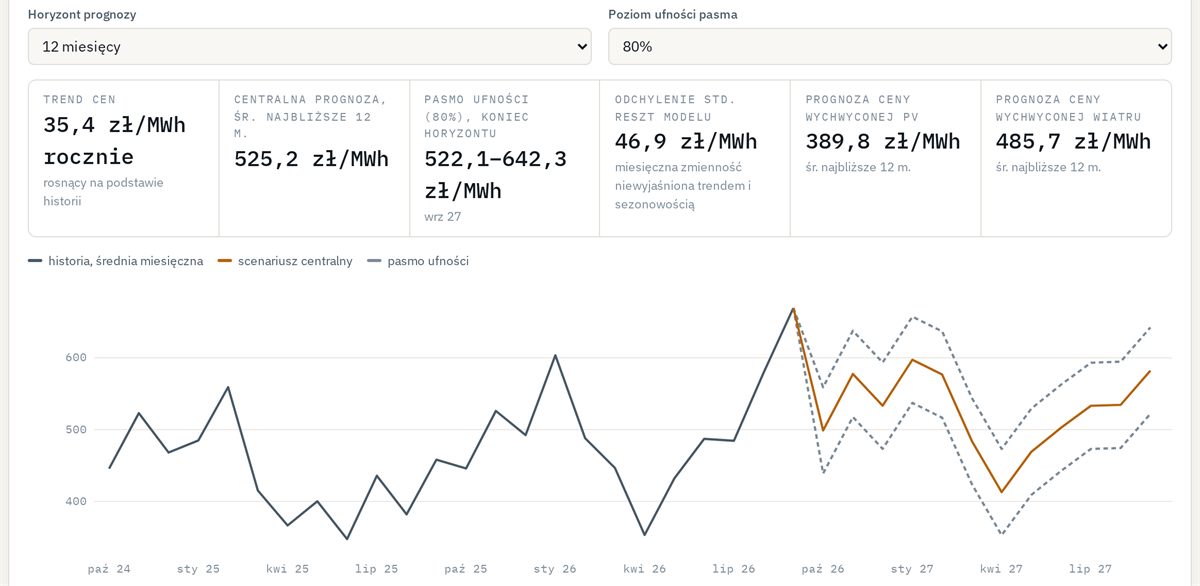
A statistical price scenario for 6, 12 or 24 months, with a band of historical deviations, plus the prices that solar and wind farms would capture. It shows what follows from the history alone. Every assumption is described.

Who it is for
Renewable investors and developers, analysts preparing business plans, companies planning their energy budget.

Example, 12-month horizon

The trend from the full months of history is +PLN 21/MWh a year. The average in the central scenario for the 12 months from September 2026: PLN 492/MWh. A solar farm would capture around PLN 365/MWh of that, a wind farm around PLN 456/MWh.

Request access

Screenshot of the price outlook calculator: history of average monthly prices and a 12-month scenario with a band of historical deviations.
12-month horizon · average band

Custom work

Your project, your numbers

The calculators work on the national profile. To order, we build a version for your project: your farm with its actual generation, your storage system with its grid connection limits, your contract. We can also prepare a one-off analysis for an investment decision.

Tell us what you want to calculate

How to get access

Request access

Tell us which calculator you are interested in and what you want to use it for. We will send you a link and password. We can also prepare a ready-made report on your assumptions.

Or write to us here

Tell us which calculator you are interested in and what you want to use it for. We send the link and password by email.

What it is about, who is responsible on your side and when you need the result.

We use the form data to answer this enquiry. Details: how we process data.

Prefer email? kontakt@nkg.pl

Access is personal: each person gets their own password, and we log every sign-in. The calculators are in alpha. The numbers show the order of magnitude and the direction; they do not replace an investment model.